. 2017 Jun;206(2):603-619.
doi: 10.1534/genetics.116.197988.

Structural Variation Shapes the Landscape of Recombination in Mouse

Affiliations

Structural Variation Shapes the Landscape of Recombination in Mouse

Andrew P Morgan et al. Genetics. 2017 Jun.

Abstract

Meiotic recombination is an essential feature of sexual reproduction that ensures faithful segregation of chromosomes and redistributes genetic variants in populations. Multiparent populations such as the Diversity Outbred (DO) mouse stock accumulate large numbers of crossover (CO) events between founder haplotypes, and thus present a unique opportunity to study the role of genetic variation in shaping the recombination landscape. We obtained high-density genotype data from [Formula: see text] DO mice, and localized 2.2 million CO events to intervals with a median size of 28 kb. The resulting sex-averaged genetic map of the DO population is highly concordant with large-scale (order 10 Mb) features of previously reported genetic maps for mouse. To examine fine-scale (order 10 kb) patterns of recombination in the DO, we overlaid putative recombination hotspots onto our CO intervals. We found that CO intervals are enriched in hotspots compared to the genomic background. However, as many as [Formula: see text] of CO intervals do not overlap any putative hotspots, suggesting that our understanding of hotspots is incomplete. We also identified coldspots encompassing 329 Mb, or [Formula: see text] of observable genome, in which there is little or no recombination. In contrast to hotspots, which are a few kilobases in size, and widely scattered throughout the genome, coldspots have a median size of 2.1 Mb and are spatially clustered. Coldspots are strongly associated with copy-number variant (CNV) regions, especially multi-allelic clusters, identified from whole-genome sequencing of 228 DO mice. Genes in these regions have reduced expression, and epigenetic features of closed chromatin in male germ cells, which suggests that CNVs may repress recombination by altering chromatin structure in meiosis. Our findings demonstrate how multiparent populations, by bridging the gap between large-scale and fine-scale genetic mapping, can reveal new features of the recombination landscape.

Keywords: MPP; copy-number variation; genetic mapping; meiotic recombination; multiparental populations; recombination hotspots.


Figures

Figure 1
Figure 1
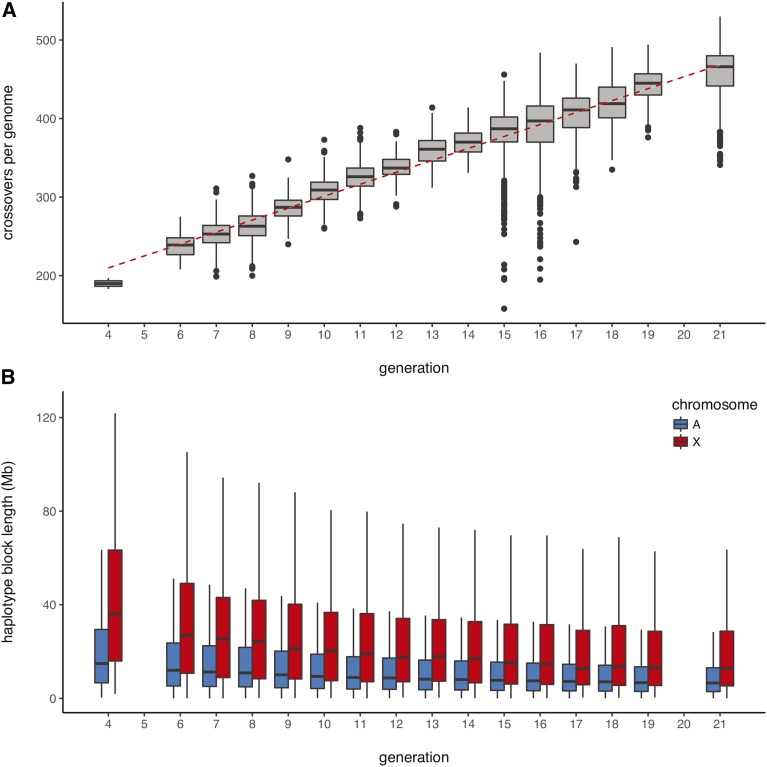
Accumulation of COs in the genomes of DO mice. (A) Distribution of the number of observed COs per genome as a function of generation number. The accumulation of COs is linear (regression line shown in red), with rate 15.2 (95% CI 15.115.4) additional autosomal COs per genome per generation. (B) Distribution of haplotype block lengths by generation.
Figure 2
Figure 2
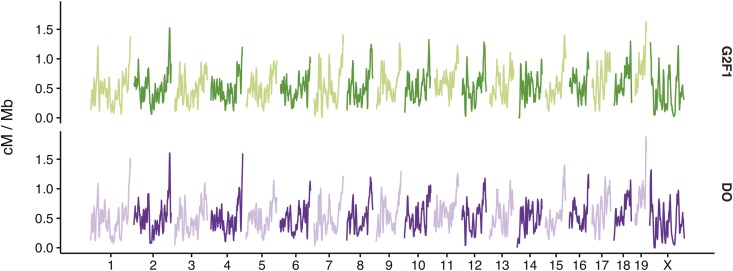
Local sex-averaged recombination rates (centimorgan/megabase), calculated in 5 Mb windows, with 1 Mb offset between adjacent windows, for the CC G2:F1 and DO.
Figure 3
Figure 3
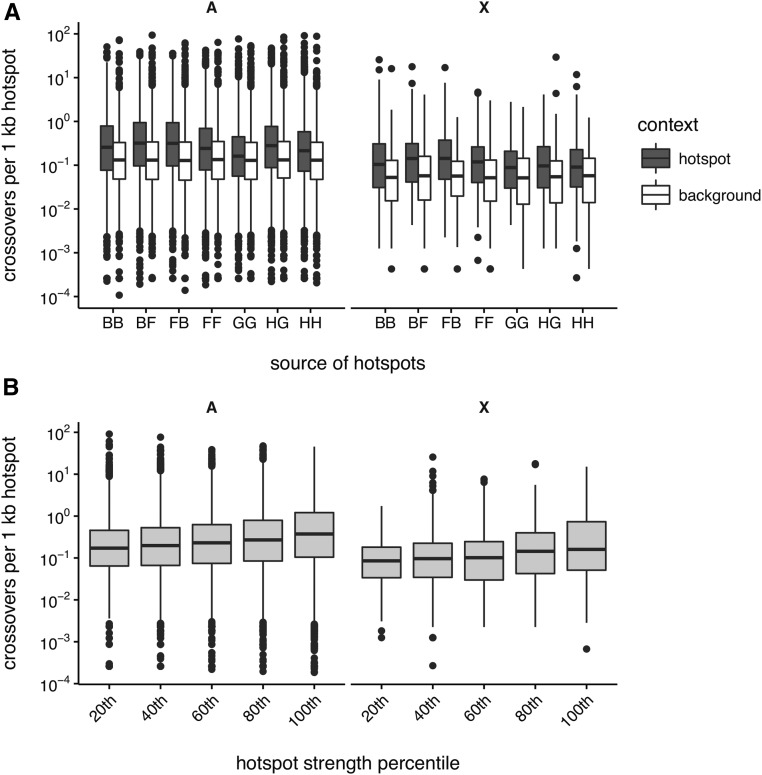
Recombination hotspot usage in the DO. (A) Distribution of CO density in hotspots defined by H3K4me3 ChIP-seq in testes from several genotypes, vs. random genomic intervals of equal size. Crosses are denoted as (maternal strain) × (paternal strain), and strains denoted by their one-letter codes: B = C57BL/6J, F = CAST/EiJ, G = PWD/PhJ, H = WSB/EiJ. (B) Distribution of within-hotspot CO density by bins of hotspot strength, denoted by their right endpoint. Overlap is computed separately for the autosomes (A, right) and X chromosome (X, left).
Figure 4
Figure 4
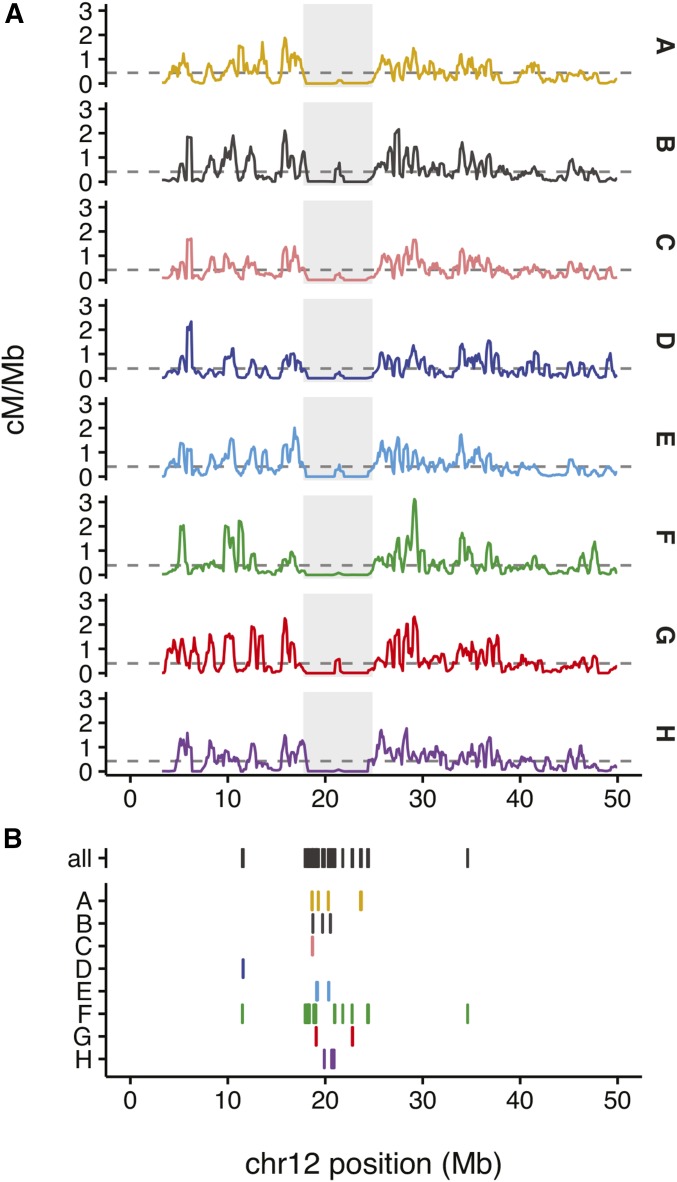
Example of a recombination coldspot on proximal chromosome 12. (A) Strain-specific local recombination rates (in centimorgan/megabase) across the proximal 50 Mb of chromosome 12. Median chromosome-wide recombination rates for each strain are marked with gray dashed lines. The coldspot is indicated by the gray shaded region. (B) CNVs ascertained in the DO. Top line, all CNVs irrespective of strain distribution pattern; remaining lines, CNVs with an allele private to a single strain.
Figure 5
Figure 5
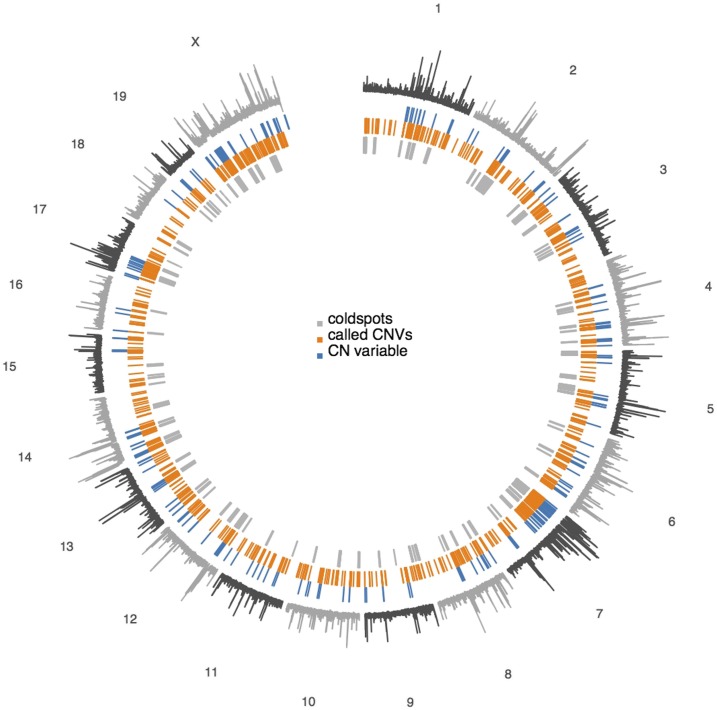
Genome-wide view of CNV in the DO. Outer track shows coefficient of variation (median/MAD) of normalized read depth across the population. Inner tracks show CNV regions identified by the HMM (blue); CNVs genotyped in individual samples (orange); and recombination coldspots (gray).
Figure 6
Figure 6
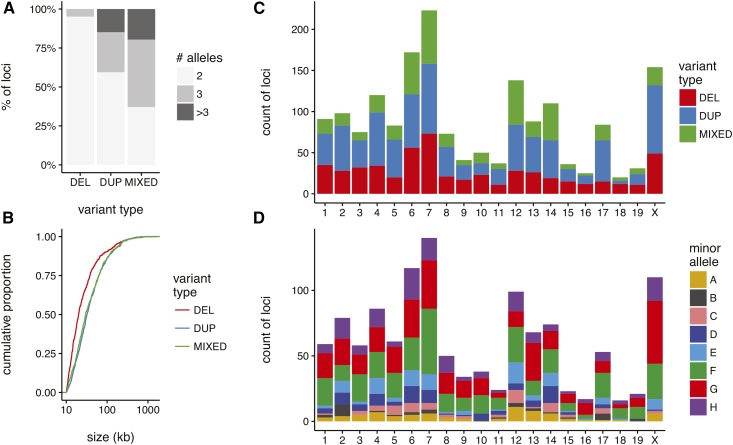
Properties of CNVs ascertained in the DO. (A) Proportion of CNV loci according to variant type (DEL, deletion; DUP, duplication; MIXED, complex variants) and number of alleles in the DO. (B) Cumulative distribution of nominal size of CNV loci by variant type, on log10 scale. (C) Count of variants per chromosome, by type. (D) Count of private variants (minor allele found in exactly one founder strain) per chromosome.
Figure 7
Figure 7
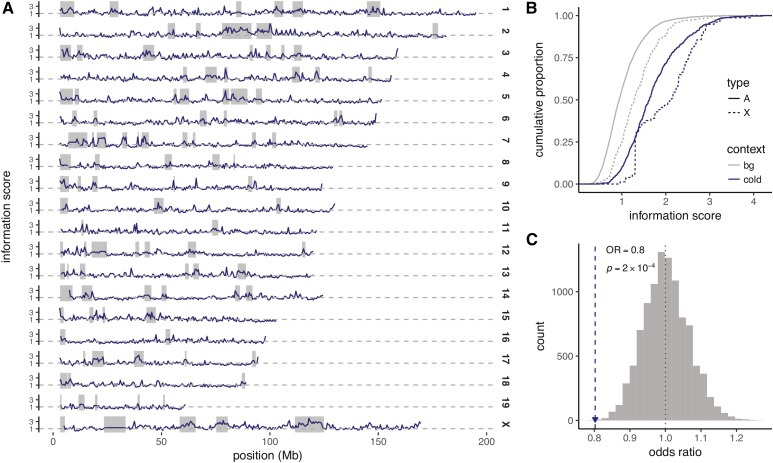
Biased distribution of COs in the vicinity of coldspots is explained by copy number differences. (A) CO information score, measuring departure from expected frequency of COs with respect to founder strain pairs, in 500 kb windows across the genome. (B) Cumulative distribution of the information score in cold regions (blue) vs. the remainder of the genome (gray), calculated separately for the autosomes (A) and X chromosome (X). (C) Odds ratio (OR) for association between copy-number difference and haplotype-specific CO incidence at CNV regions (blue track in Figure 5), vs. 10,000 permutations (histogram).
Figure 8
Figure 8
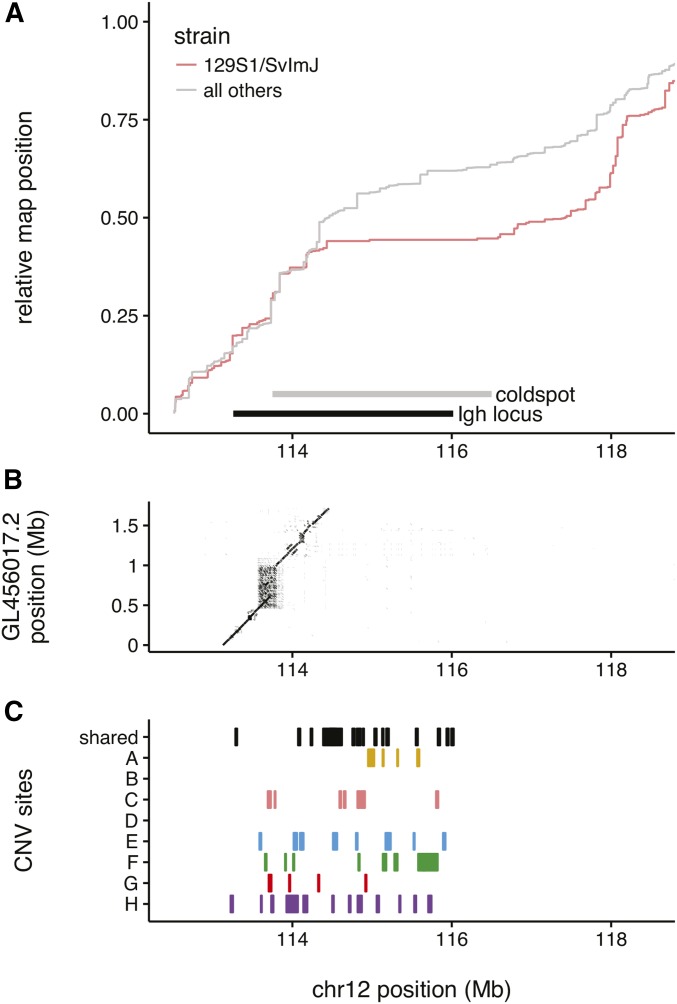
Example of a haplotype-specific recombination coldspot at the Igh locus. (A) Cumulative recombination map for COs involving (pink) or not involving (gray) the 129S1/SvImJ haplotype in the vicinity of the Igh locus on distal chromosome 12. Maps are scaled to arbitrary units so that both start at zero and end at one. Extent of 129S1/SvImJ-specific coldspot is indicated by gray bar. (B) Dotplot representation of alignment of GL456017.2 (alternate sequence derived from 129S1/SvImJ BACs) to the mouse reference genome. (C) CNVs in the vicinity of the Igh locus. Alleles private to each strain are shown in individual tracks; alleles shared by two or more strains are shown in top track.
Figure 9
Figure 9
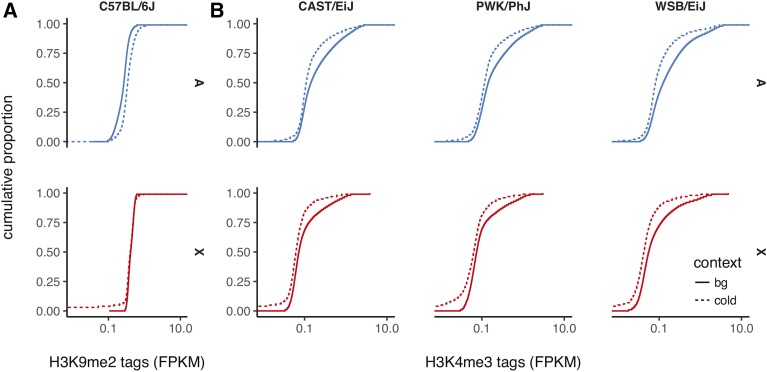
Epigenetic features of coldspots in male germ cells. (A) Distribution of tag read density (as fragments per million mapped, FPKM) for the H3K9me2 mark associated with heterochromatin in pachytene spermatocytes from C57BL/6J males. Distributions are plotted separately for autosomes (A, blue) and the X chromosome (X, red), and for coldspots (dashed lines) vs. randomly drawn regions of equal size (solid lines). (B) Distribution of tag read density for the H3K4me3 mark associated with recombination hotspots and actively transcribed genes in mixed-stage spermatocytes from three inbred strains.
Figure 10
Figure 10
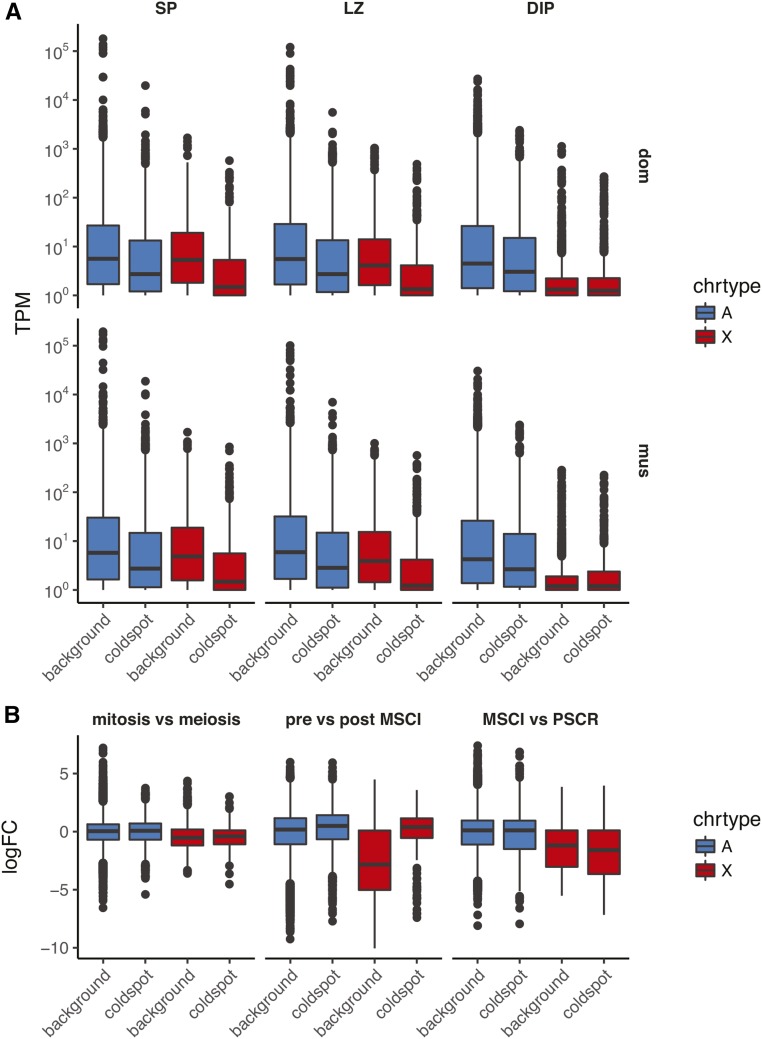
Transcriptional control of coldspots in male germ cells. (A) Distribution of normalized expression levels (transcripts per million mapped reads, TPM) according to chromosome type (autosomes, A; X chromosome, X) and coldspot status in WSB/EiJ×LEWES/EiJ F1 (dom) or PWK/PhJ×CZECHII/EiJ F1 (mus) males. SP, spermatogonia; LZ, leptotene/zygotene spermatocytes; DIP, diplotene spermatocytes. (B) Distribution of log2 fold-difference (logFC) values in comparisons between stages of spermatognesis. Horizontal axis and color scheme follow (A). MSCI, meiotic sex chromosome inactivation; PSCR, postmeiotic sex chromosome repression.

References

    1. Auton A., Li Y. R., Kidd J., Oliveira K., Nadel J., et al. , 2013. Genetic recombination is targeted towards gene promoter regions in dogs. PLoS Genet. 9: e1003984. - PMC - PubMed
    1. Axelsson E., Webster M. T., Ratnakumar A., Consortium T. L., Ponting C. P., et al. , 2012. Death of PRDM9 coincides with stabilization of the recombination landscape in the dog genome. Genome Res. 22: 51–63. - PMC - PubMed
    1. Bailey J. A., Eichler E. E., 2006. Primate segmental duplications: crucibles of evolution, diversity and disease. Nat. Rev. Genet. 7: 552–564. - PubMed
    1. Baker C. L., Kajita S., Walker M., Saxl R. L., Raghupathy N., et al. , 2015. PRDM9 drives evolutionary erosion of hotspots in Mus musculus through haplotype-specific initiation of meiotic recombination. PLoS Genet. 11: e1004916. - PMC - PubMed
    1. Barski A., Cuddapah S., Cui K., Roh T.-Y., Schones D. E., et al. , 2007. High-resolution profiling of histone methylations in the human genome. Cell 129: 823–837. - PubMed

Publication types

LinkOut - more resources